9: k-Nearest Neighbors Classification

Readings

From An Introduction to Statistical Learning with Applications in R by Drs. Gareth James, Daniela Witten, Trevor Hastie, and Rob Tibshirani:

  • Statistical Learning

  • Classification

The book is freely available at https://www.statlearning.com/

Also, check out the following videos:

Topics

  • k-Nearest neighbors

Classification

  • Recall that regression aims to predict a numerical outcome. In contrast, classification aims to predict a categorical outcome, that is, assigning an observation to a known category or class.

  • Classification problems frequently occur in practice. Some examples include:
    • Email spam detection: spam or not spam
    • Medical diagnosis: disease or no disease
    • Fraud detection and loan approval
    • Image recognition: animals, digits, objects
    • Sentiment analysis: positive, negative, neutral

k-nearest neighbors

  • The \(k\)-nearest neighbors (kNN) classifies a new observation by finding its \(k\) closest training data points and applying the majority rule. This is considered as a nonparametric method because it does not involve estimation of parameters in an assumed functional form.

From Dr. Guangliang Chen
  • The Euclidean distance is a popular distance measure between two numerical observations \((x_1, x_2, \dots, x_p)\) and \((y_1, y_2, \dots, y_p)\)

    \[\sqrt{ (x_1 - y_1)^2 + (x_2 - y_2)^2 + \dots + (x_p - y_p)^2 }\]

  • The number of nearest neighbors \(k\) affects the classification results.

From Dr. Guangliang Chen
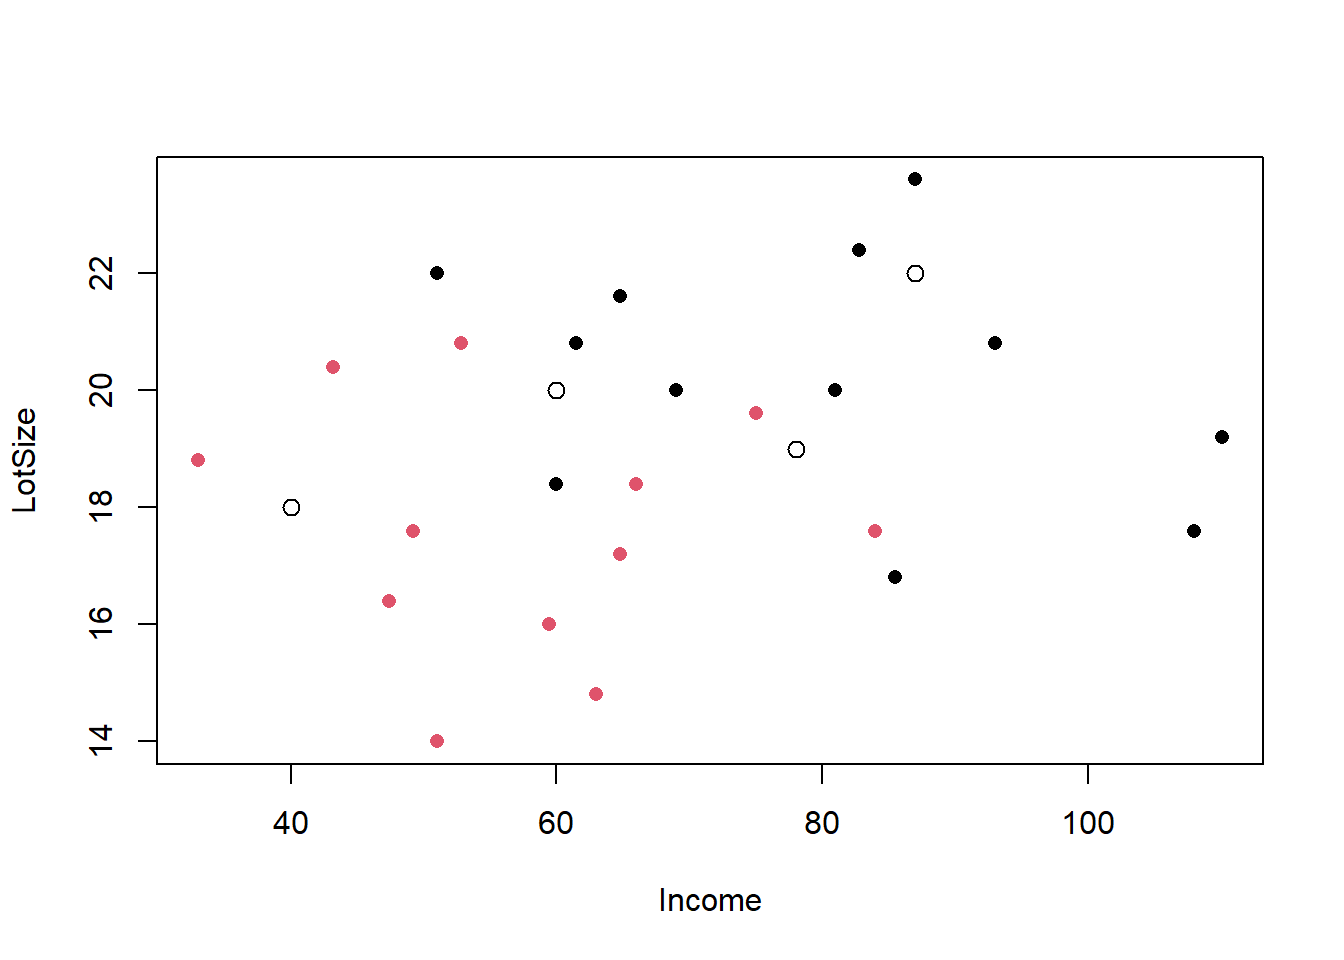
  • A riding-mower manufacturer is interested in classifying families in a city into prospective owners or non-owners on the basis of income (in thousand dollars) and lot size (in 1000 squared feet). A pilot random sample is given in the mowers data set.

load(url('https://github.com/hungtong/DS-01-101/raw/refs/heads/main/dataset/mowers.rdata'))

new_households <- data.frame(
  Income = c(40, 87, 60, 78),
  LotSize = c(18, 22, 20, 19)
)

plot(mowers[, -1], col = mowers$Ownership, pch = 16)
points(new_households, cex = 1.2)

  • Ownership prediction may vary using different numbers of neighbors \(k\).
library(class)
Warning: package 'class' was built under R version 4.5.3
pred_k1 <- knn(mowers[, -1], new_households, mowers$Ownership, k = 1)
pred_k3 <- knn(mowers[, -1], new_households, mowers$Ownership, k = 3)
pred_k5 <- knn(mowers[, -1], new_households, mowers$Ownership, k = 5)
pred_k7 <- knn(mowers[, -1], new_households, mowers$Ownership, k = 7)

cbind(new_households, pred_k1, pred_k3, pred_k5, pred_k7)
  Income LotSize  pred_k1  pred_k3  pred_k5  pred_k7
1     40      18 Nonowner Nonowner Nonowner Nonowner
2     87      22    Owner    Owner    Owner    Owner
3     60      20    Owner    Owner    Owner Nonowner
4     78      19 Nonowner    Owner    Owner    Owner
  • Choosing the number of neighbors \(k\) is an important decision. Generally speaking, if \(k\) is too low, we may get misleading signal. If \(k\) is too high, we will not learn the local structure in the data.

  • In practice, to choose \(k\), we typically split the data into a training set and a validation (test) set. We then try several different values of \(k\), for each of which we train the model, predict the labels of the validation (test) data, and compute the accuracy. The value of \(k\) that gives the highest accuracy on the validation set is typically chosen as the best one.

n <- nrow(mowers)

set.seed(101)

train_ids <- sample(1:n, size = 17)     # 24 * 0.7 = 17
test_ids <- setdiff(1:n, train_ids)     # 24 - 17 = 7

X_train <- mowers[train_ids, -1]
X_test <- mowers[test_ids, -1]

y_train <- mowers$Ownership[train_ids]
y_test <- mowers$Ownership[test_ids]

pred_k1 <- knn(X_train, X_test, y_train, k = 1)
pred_k3 <- knn(X_train, X_test, y_train, k = 3)
pred_k5 <- knn(X_train, X_test, y_train, k = 5)
pred_k7 <- knn(X_train, X_test, y_train, k = 7)

mean(pred_k1 == y_test)    # 0.7142857
mean(pred_k3 == y_test)    # 0.7142857
mean(pred_k5 == y_test)    # 0.5714286
mean(pred_k7 == y_test)    # 0.7142857

💻 Hands-On

Consider the iris data set, where the response variable is the flower species and the predictors are the four length and width measurements. Split the dataset into a training set (about 70%) and a test set (about 30%). Using the K-nearest neighbors (KNN) method, fit models with different values of \(k\), such as \(k = 1, 3, 5, 7, 9\).

For each value of \(k\), compute the classification accuracy on the test set.

Which value of \(k\) gives the highest test accuracy?

n <- nrow(iris)

set.seed(101)

train_ids <- sample(1:n, size = 105)    # 150 * 0.7 = 105
test_ids <- setdiff(1:n, train_ids)

X_train <- iris[train_ids, -5]
X_test <- iris[test_ids, -5]

y_train <- iris$Species[train_ids]
y_test <- iris$Species[test_ids]

pred_k1 <- knn(X_train, X_test, y_train, k = 1)
pred_k3 <- knn(X_train, X_test, y_train, k = 3)
pred_k5 <- knn(X_train, X_test, y_train, k = 5)
pred_k7 <- knn(X_train, X_test, y_train, k = 7)

mean(pred_k1 == y_test)    # 0.9111111
mean(pred_k3 == y_test)    # 0.9111111
mean(pred_k5 == y_test)    # 0.9111111
mean(pred_k7 == y_test)    # 0.9333333